As someone who is constantly testing games and evaluating how they perform, I utilize the Steam Deck overlay all the time. Getting all the data regarding the framerate, temps, and utilization is very important, but even something as simple as battery life can be really nice. On the ASUS ROG Ally, there is an in-game that's provided by Armoury Crate, but it doesn't update as fast as I would like or provide all the info I want to see.
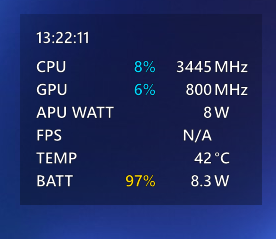
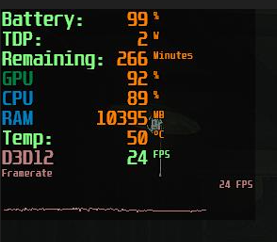
One of the best overlays that is used across Windows devices is MSI Afterburner, which is awesome, but doesn't show any battery information. But, with the help of a second program, we can add in more information and create the ultimate overlay that is highly configurable to whatever information you want to see. And, after you are done, you will be able to get any information you want in the corner of your screen, including estimated time remaining on your battery. So let's dive right on in!
Downloading The Programs
MSI Afterburner + RivaTuner Statistics Server
So the first of the two programs we need to do is download and install MSI Afterburner. This is the program that will actually host your stats, as well as provide some, in the corner of your screen. With it, another program called RivaTuner Statistics Server will be downloaded.
Step 1:
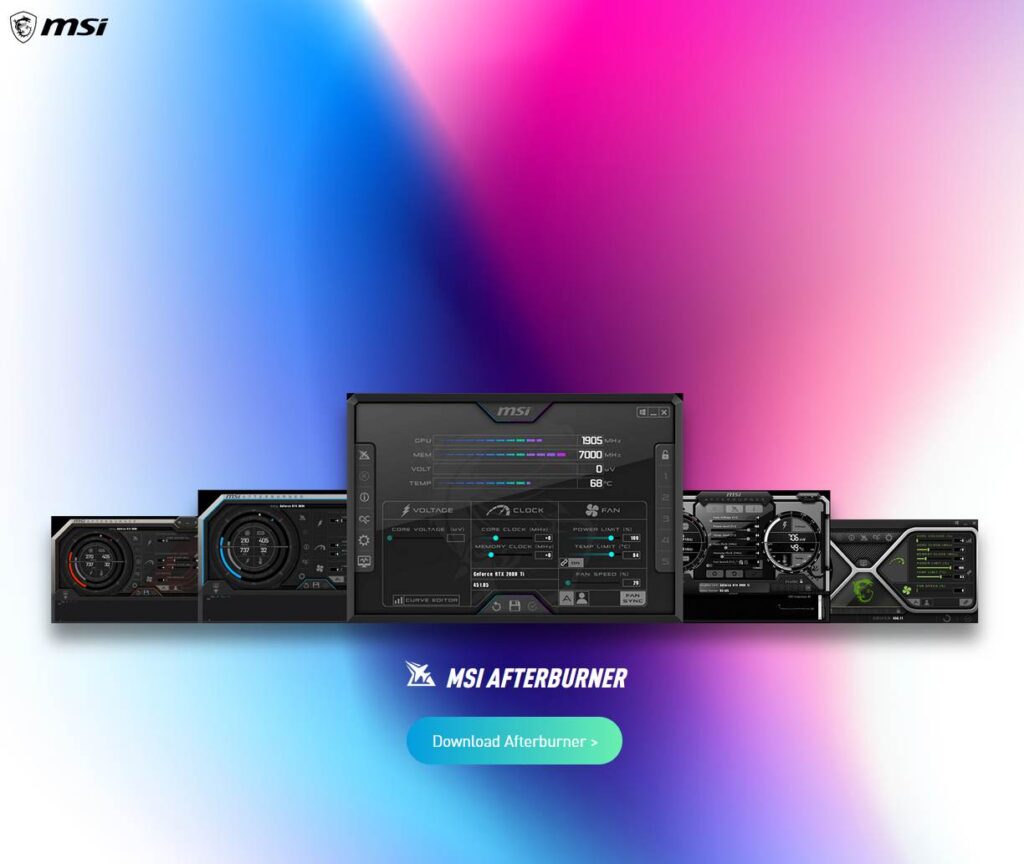
Go to the MSI Afterburner website and download the program. All you have to do is press the giant, rainbow button that appears there that says "Download Afterburner" and it will download the zip file.
Step 2:
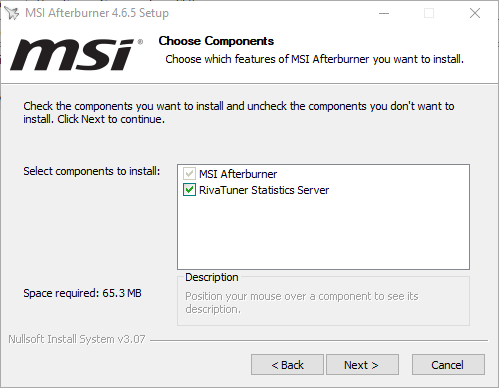
Go ahead and launch the setup application inside the downloaded zip file. Go through all the steps, accept the agreement, and make sure RivaTuner Statistics Server is checked off and downloading too.
Step 3:
Once that is done, you should see a new icon appear on your desktop. Don't open it yet though, we still have one more program to install!
HWInfo
The second program we will need is one called HWiNFO, which will give us the other statistics not natively shown by MSI Afterburner (like the battery stuff). The newest version of HWiNFO (7.44 at the time of writing) will make you re-select a specific option every 12 hours unless you buy the Pro version. While I recommend doing that to support the developer, the last version before v7 (6.42) doesn't make you do this and will still show all the necessary information. With this in mind, I will be using 6.42 as constantly doing this on a mobile device can be a bit annoying.
Step 1:
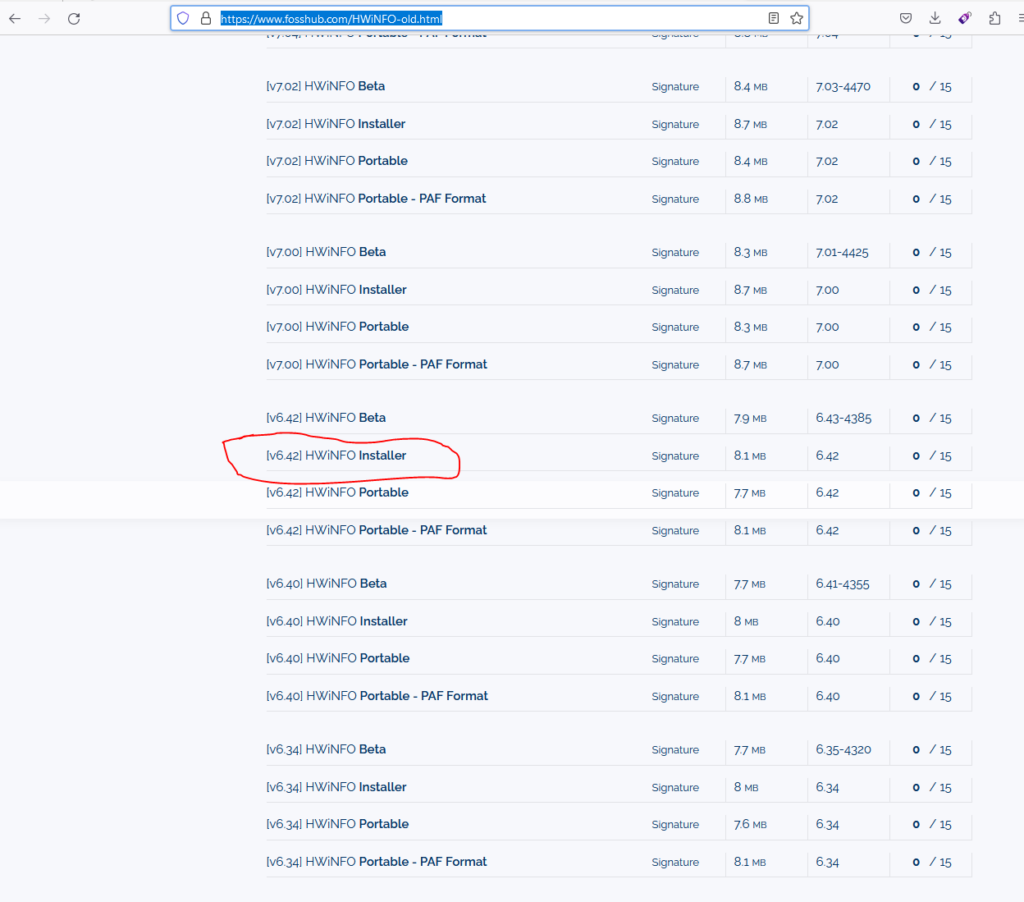
Go to the official FossHub for HWiNFO and scroll down the versions until you find the v6.42 HWiNFO Installer. Go ahead and click it and it will automatically download the file.
Step 2:
Once done, go ahead and install HWiNFO. That shouldn't take long, so once this is done, we will be ready to start setting up!
Setting Up Your Overlay
So with everything downloaded, we now need to set up the overlay! There is a lot you can do with the overlay and how you can customize, so I won't go over it in intense detail, but I will cover the basics so I can provide a starting point, as well as show what it is capable of.
Step 1:
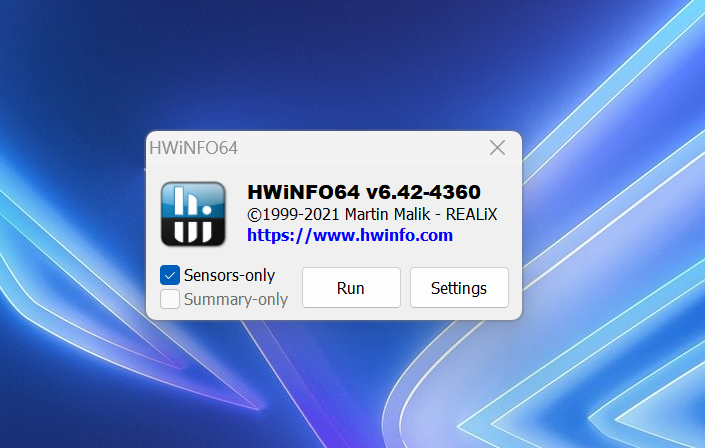
Open up HWiNFO and make sure the "Sensors Only" box is checked. This will only happen the first time you try launching the application. After that, you can minimize the HWiNFO window.
Step 2:
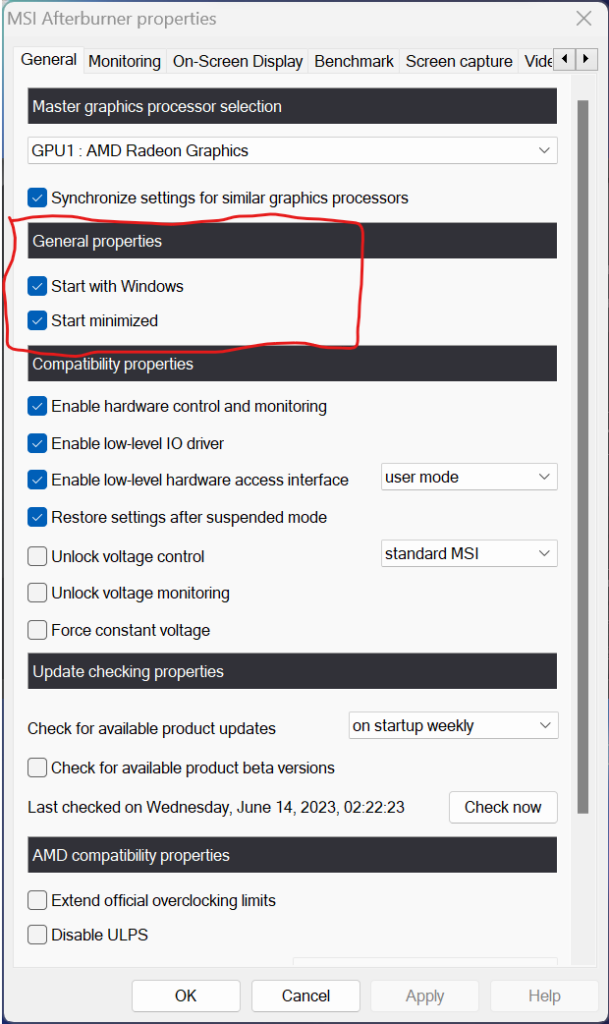
Open MSI Afterburner and click the cogwheel on the left side of the window. In the general tab, check off the options to "Start with Windows" and "Start Minimized". After that, go to the monitoring tab.
The monitoring tab is where you are going to put whatever statistics you want into your on-screen display. You can pick and choose what you want there, but before we go into that, let's bring in the battery stats.
Step 3:
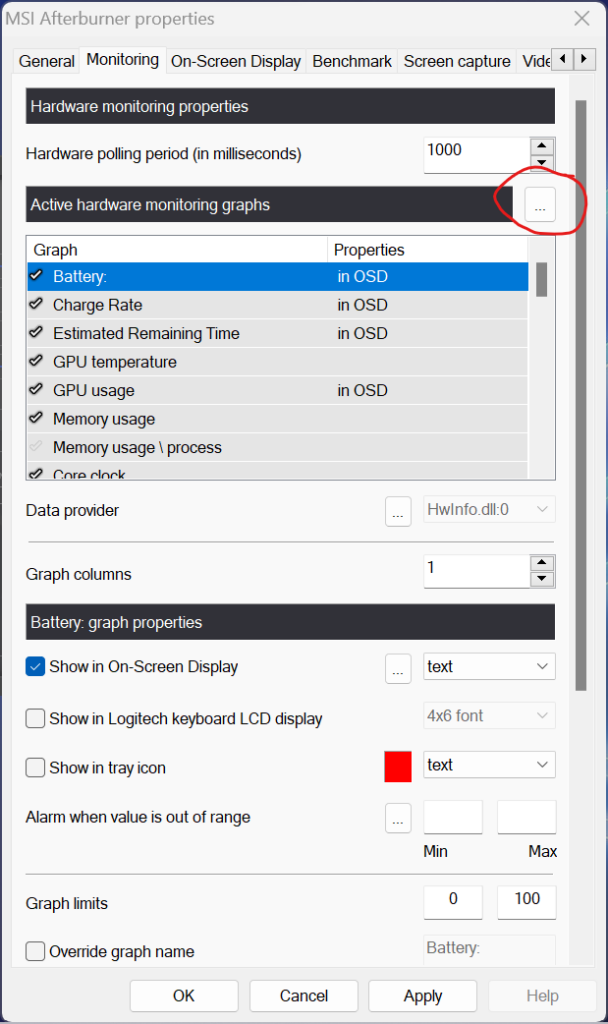
In the monitoring tab, go ahead and click the ellipses (...) next to the "Active hardware monitoring graphs" text towards the top.
Step 4:
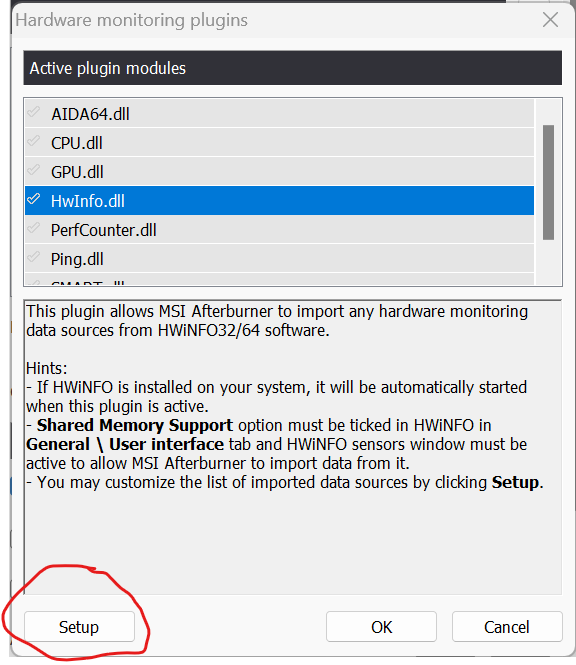
Find the "HwInfo.dll" and click on it. Then, click on "Setup".
Step 5:
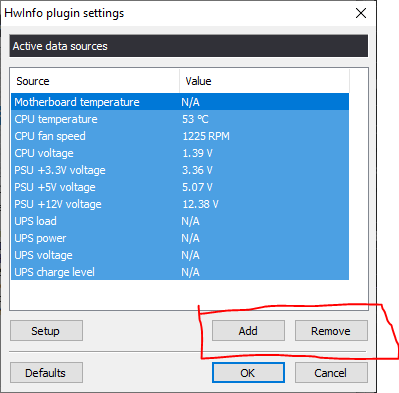
Once you click that, you will see a new window with "Active data sources". Any sources that appear here will become available for MSI Afterburner to show in the overlay, but we are going to start from scratch for this guide. Highlight all of the options here and click "Remove". Then, once done and there are no sources there, go ahead and click "Add".
Step 6:
The big thing HWiNFO shows that MSI Afterburner doesn't pull from is the battery information, which is what we will be adding. Scroll down and towards the bottom, you will find the "ASUSTeK ASUS Battery" group. The 3 values I will be pulling are:
- Charge Level (To show how much battery is left in percentage format)
- Charge Rate (This shows how much overall power is being drained from the system)
- Estimated Remaining Time (This will estimate how much time is left until the battery is dead)
- Drive Temperature (To show how hot the device is getting)
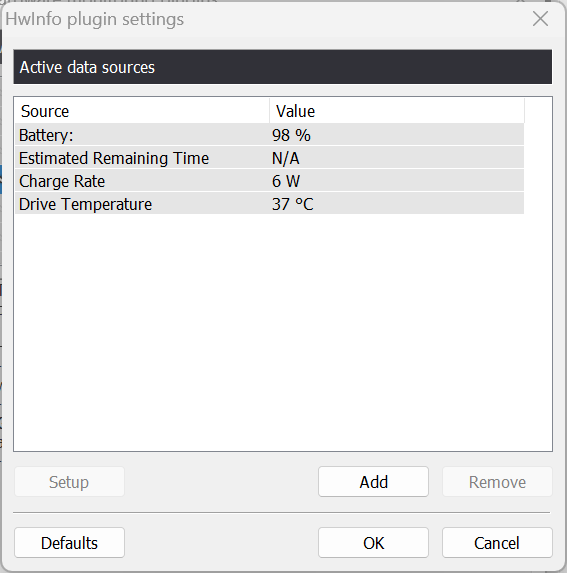
Go ahead and click on the checkmark next to these 4 and then click on "OK". You can look through and add whatever values you want from here, but those are the ones I would consider essential. There are also some that will be in MSI Afterburner by default, so I would do these 4, see what's in Afterburner, then come back!
Step 7:
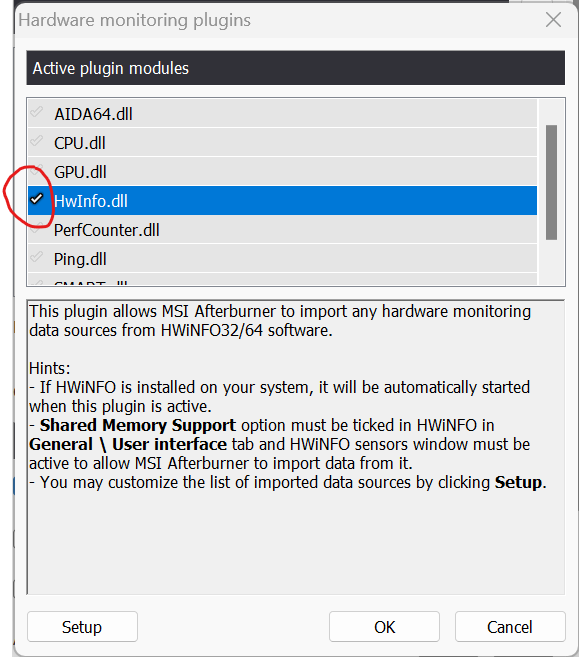
Now go ahead and click on the checkmark to the left of the "HwInfo.dll" entry in the "Active plugin modules" tab. Once the checkmark is visible, click "OK" again.
Step 8:
Now you are back at the Monitoring tab of the properties! So let's start adding to our overlay. Go through this list and click on the checkmark next to each value you want. Then, click on them and check off the box that says "Show in On-Screen Display" and then hit apply at the bottom. You will know it is enabled when the properties above say "in OSD". For a bit of a run down, here are the values I would recommend adding, depending on the information you want to see:
- GPU Usage (Shows how much of the GPU is being used in percentage form)
- CPU Usage (Shows how much of the CPU is being used in percentage form)
- RAM Usage (Shows how much RAM is being used in MB form)
- Drive Temperature (Shows how hot the device is getting in Celsius form)
- Framerate (Shows the framerate of the current game.)
- And the 4 listed in Step 6
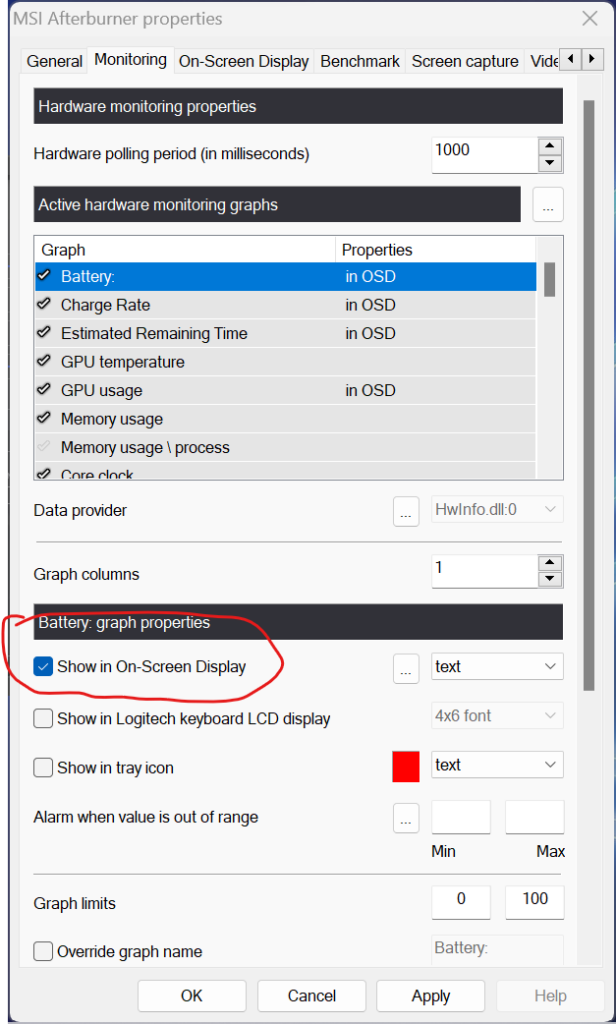
Step 8.5:
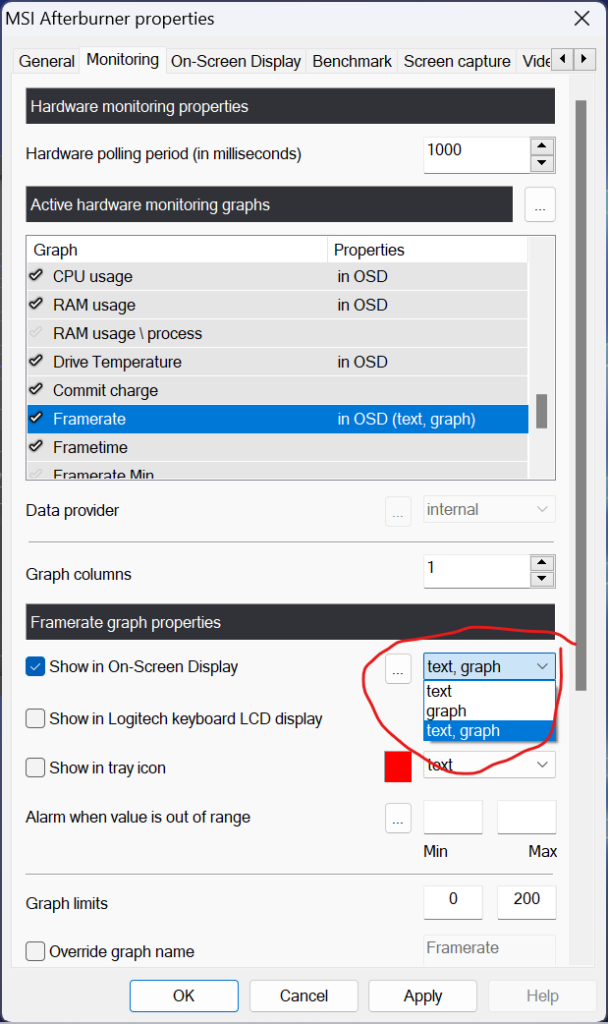
For framerate, I like to see the text and a framerate graph, so once that is highlighted, change the box across from the "Show in On-Screen Display" to say "text, graph". This will show both the text and the graph for the framerate.
Step 9:
Now the overlay is actually almost completely set up! The final piece of the puzzle is the RivaTuner Statistics Server. To open it, go to the bottom of your screen and click on the up arrow towards the right side. You should see a new window of small icons, go ahead and click on the one that looks like a blue screen desktop with a red number "60" in the corner.

Step 10:
With that open, go ahead and first make sure the program says "On" next to "Start with Windows" and "Show On-Screen Display" in the top right.
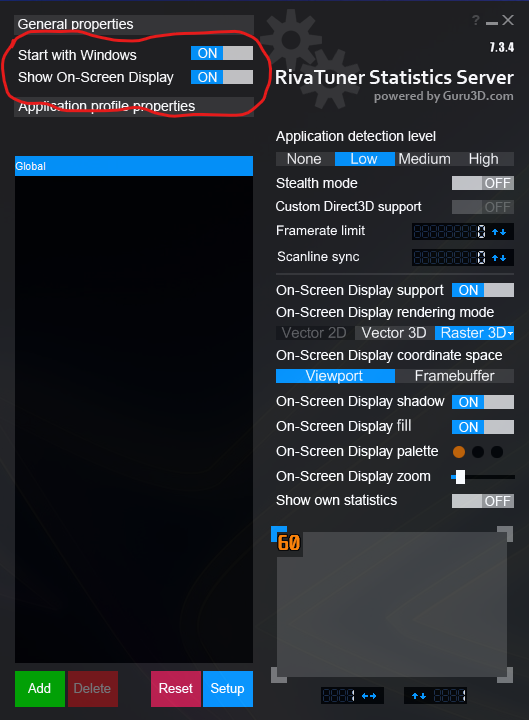
After that, you can minimize everything! You are technically done now. Your overlay should be set up and will have all of the information we went over earlier in the guide. Also, whenever the device boots up, your overlay should automatically open too and you won't have to worry about a thing! Though, when you look at it, you may realize your overlay looks a bit weird and you will want to customize it a bit with specific text, coloring, and spacing. Don't worry though, it isn't hard to do when you know where to look!
Customizing Your Overlay
Overlay Size + Background
Probably the most important part of the overlay is how much space it takes up. Thankfully, we can easily change this by going into the RivaTuner Statistics Server. On the right side, above the little window, there is a bar that says "On-Screen Display Zoom". Moving the bar to the right will make it larger, while moving to the left makes it smaller. You will also be able to see it changed in the mock screen below, but I would look in-game first.
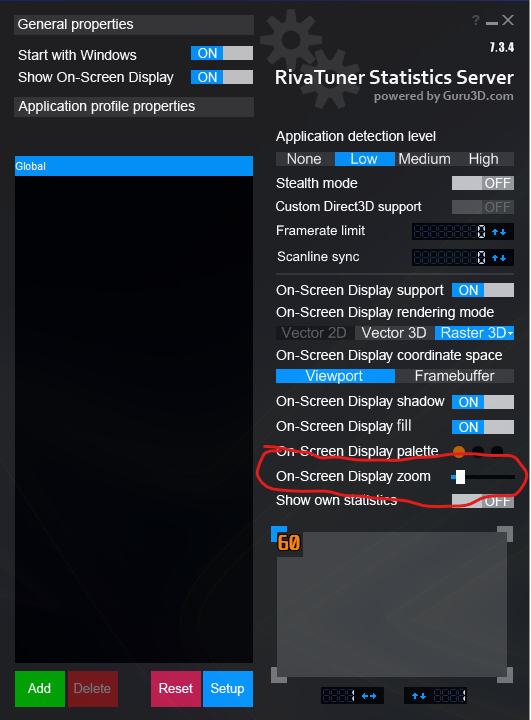
Two above the zoom option will be the option for "On-Screen Display Fill". This will give your overlay a transparent black backing to help the overlay stand out and be a bit more readable. I have this set to ON, but seeing it clearly is more important for me, so it is totally optional.
Changing Value Names in the Overlay
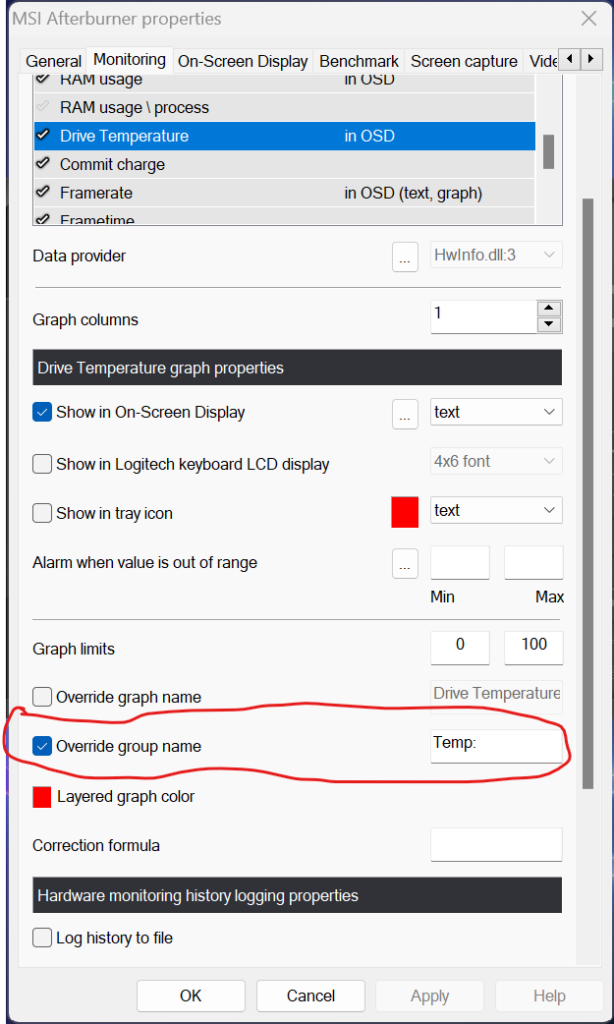
So now, looking at the values in the overlay, you will see some have weird names or no names at all! This can be fixed pretty easily as well in MSI Afterburner. Go ahead to the "Monitoring" tab in the settings and find the value you want to have a name. Click on it and scroll down to "Override Group Name". Check off that box and then, to the right of it, type in the name you want. After that, click Apply and it should now have a name next to the value.
For my example, I did this with the Drive Temperature and renamed it from nothing to "Temp:".
Changing Overlay Display Order
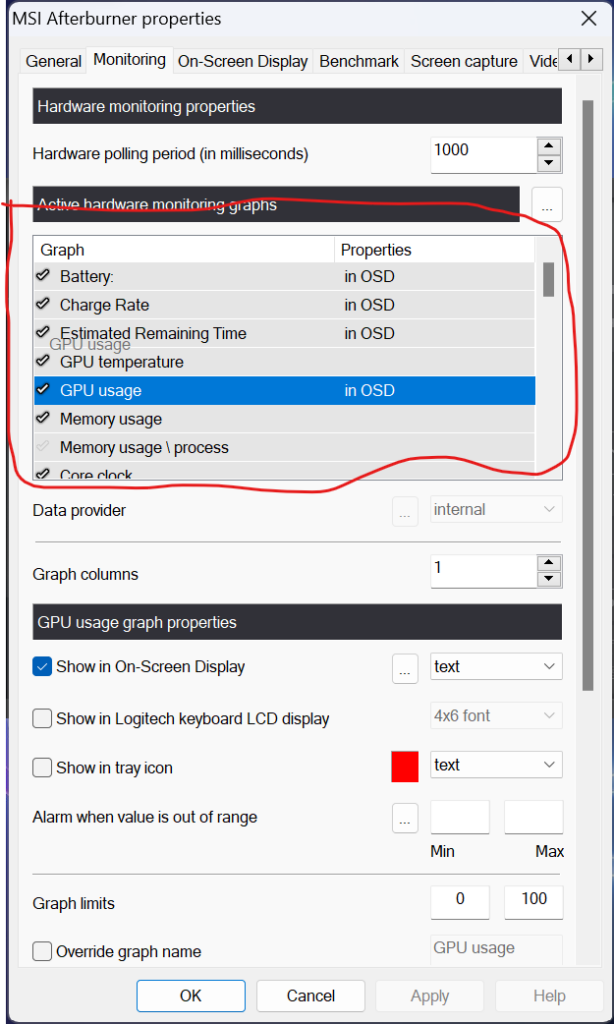
If you don't like the order in which the information is being displayed, this can be changed too. In the "Monitoring" tab of MSI Afterburner's properties, you can select and drag the options in the "Active hardware monitoring graphs" area. The values on top of the others will be shown on top of the others in the overlay.
So, if my "Charge Level" value is above my "Charge Rate" option in MSI Afterburner's properties, it will be above as well in the overlay.
Colors, Spacing, and the Length of the Graph
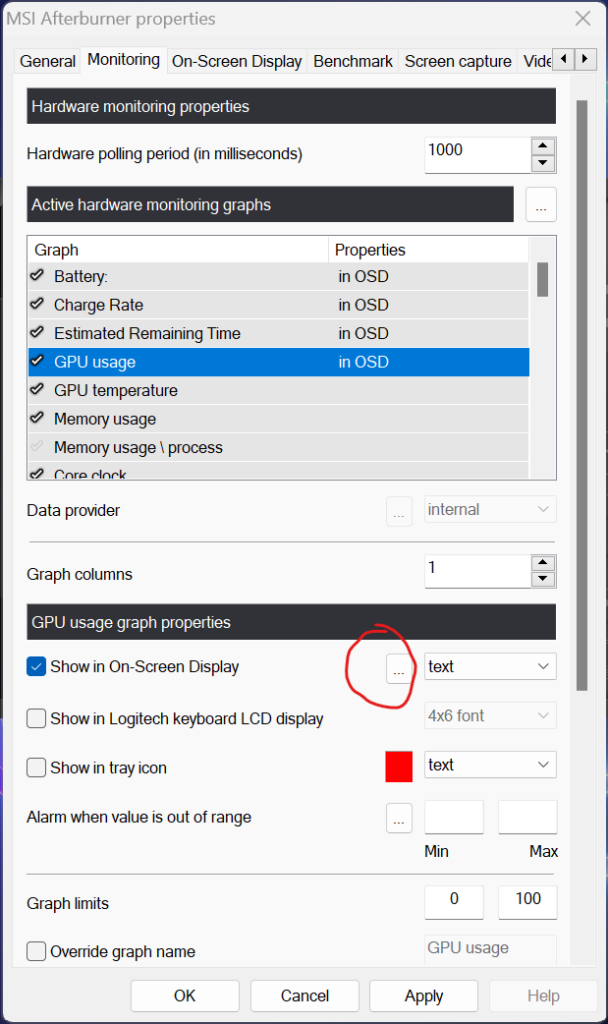
Now we get to coloring and finding ways to condense the overlay so it takes up the least amount of space possible. This is all going to be done within the "Active layout properties" window. To get to it, click on any value and click on the ellipses (...) next to the "Show in On-Screen Display". At this new screen, you will see a lot of different options, but I will show you the three most important to me.
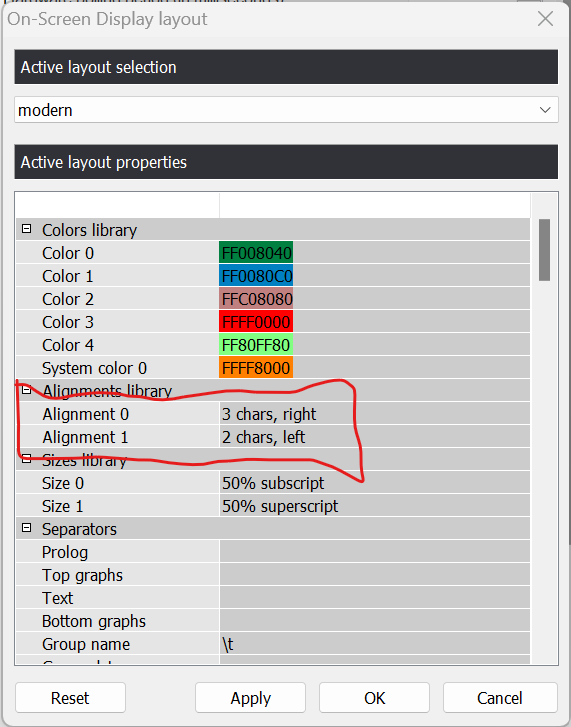
First, we see the "Colors library". MSI Afterburner only supports having 6 different colors. You can change these however you see fit by double clicking on the color and then selecting the one you want in the new screen. After you find the color you like, press "OK" at the bottom and then hit "Apply" in the properties screen. Scrolling down a little bit, you will also see group color, which is where you can customize the name colors further. The "System Color 0" at the top acts independently from these colors and will be the one that any values show in the overlay.
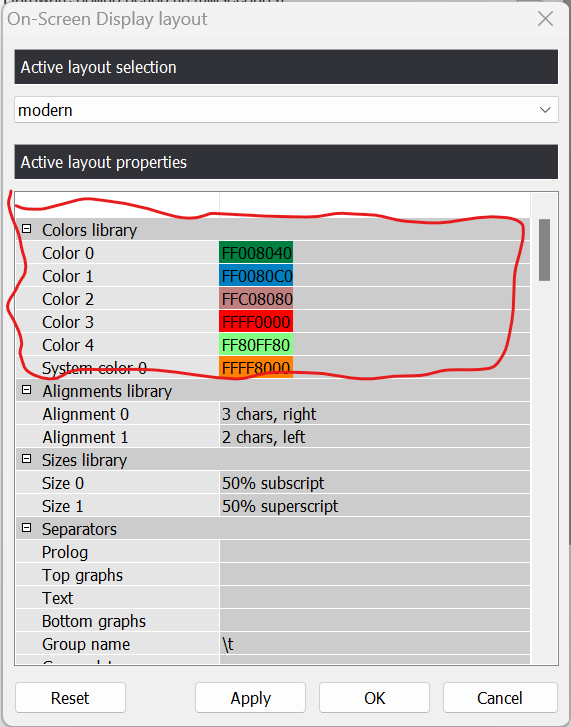
Then we have spacing. Right underneath the colors is the "Alignments library". These will reduce the spacing between the text and their values, as well as the spacing of the transparent background. "Alignment 0" will deal with the text spacing, while "Alignment 1" deals with the background. To make it as small as possible without looking all mushed together, I went with 3 chars, right for Alignment 0 and 2 chars, left for Alignment 1.
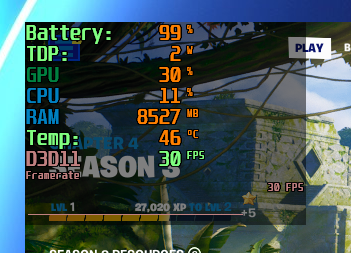
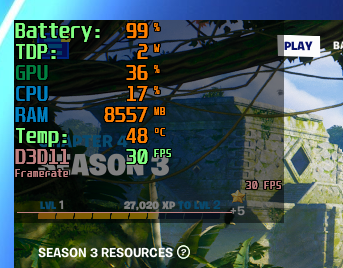
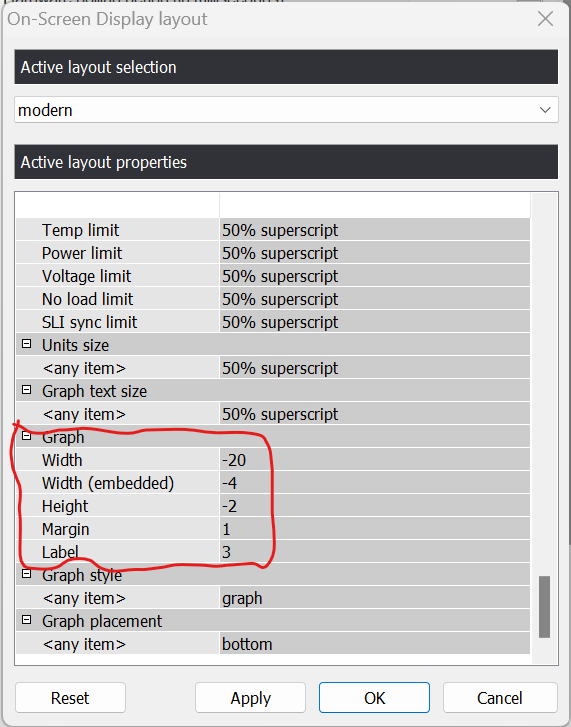
Finally, we have the graph length. If you don't have a graph for any of your values, you can skip this, but if you do, here is how to change its size. Scroll all the way down in properties and you will see the "Graph" tab. To make it smaller, change the "Width" size to a larger negative number. In my case, I changed it to "-20" to condense the graph a bit more.
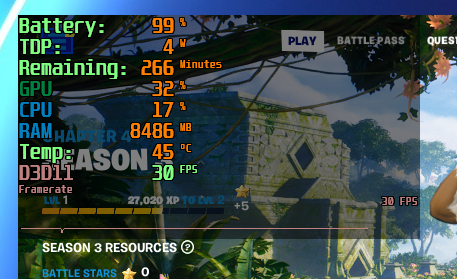
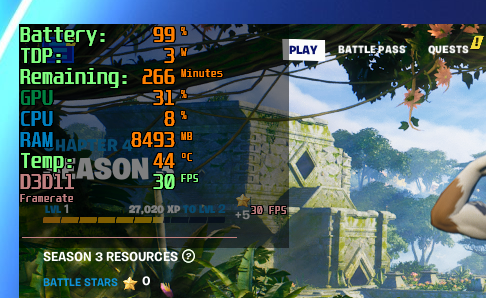
There is definitely more you can do here, but this guide will be significantly longer if I went over them! I encourage you to try out the options and see what works best for you, but those will be the ones I recommend modifying to begin with.
Changing Font
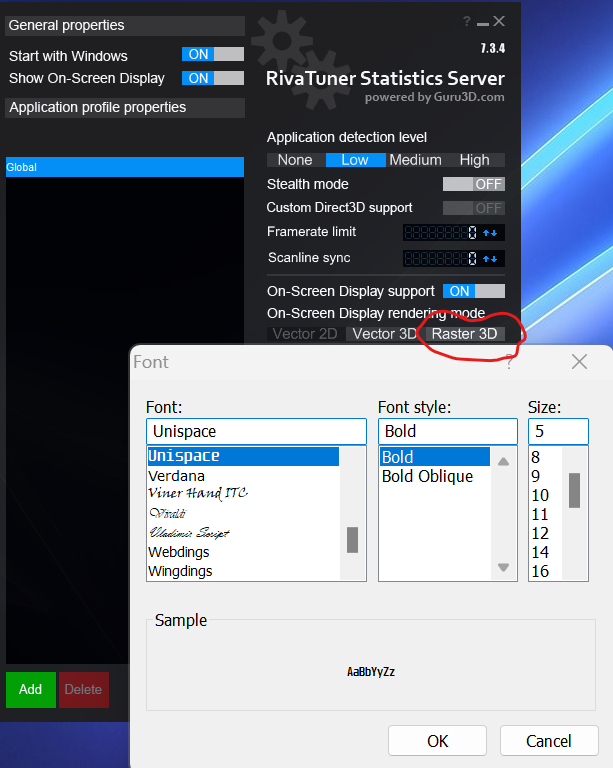
If you aren't liking the Unispace font, there is a way to change it! Go ahead into RivaTuner Statistic Server and look at the right side again. There will be an option there that says "Raster 3D" and it should be highlighted in blue. Click on it and it will bring up a font window. Here you can change the actual font, style, and size. Personally, I didn't change much here as I like the Unispace font, but to each their own here!
And that's all! Those are what I changed and did to give myself a better overlay that was not only customizable, but gave me more updated statistics and information. It is a bit of a process, but after this, you shouldn't have to worry about doing it again since we set it to always launch and start minimized. Personally, I prefer this overlay compared to the one ASUS provides, but in the end, it's all about choice!
If you enjoyed this guide, be sure to check out the rest of the content on SteamDeckHQ! We have a wide variety game reviews and news that are sure to help your gaming experience. Whether you're looking for news, tips and tutorials, game settings and reviews, or just want to stay up-to-date on the latest trends, we've got your back.


I would like to be a part of steam deck community and don't want to have a constant advertisement for other consoles so I will try to find another source of best settings for my steam deck. For some time site was really useful so thank you and wish you good luck.
P.S. with this approach handledgaminghq will be a better name, in my opinion.
That's totally okay! While we will still prioritize the Steam Deck and still focus our reviews on it, and that output won't slow down, I do understand not wanting to see others though. We made the decision to branch out to provide new viewpoints on all devices, especially the Steam Deck! Thank you for reading, I do hope to see you back again one day!
As for the name, we are looking into creating a sister-site to house everything non-Steam Deck VS just doing it all here, but I will take note into account!
I hope to see more ROG ALLY related content, tips, news etc.
You definitely will!
Can't find the "Charge Rate" and "Estimated Remaining Time" in the "ASUSTeK ASUS Battery" group, only the "Charge level". Is there something I missed?
Hmm...reboot the device and open HWiNFO. Try scrolling down there and seeing it. If it isn't there, join our discord and send me a DM. I will investigate further! discord.gg/M2stMsqEUS
Thanks for the awesome writeup!
2 questions: why drive temp? Isnt gpu temp in this case the soc temp?
What keybind do you recommend setting up for the overlay?
I will look into it, but I was actually going based loosely on the overlay Armoury Crate provides. The temp in the Armoury Crate overlay is the drive temp.
can we easily turn it on or off with button shortcut or something like that?
Yes! You can bind a hotkey to turning the overlay on and off in the "On-Screen Settings" of MSI Afterburner.